What is Hypothesis?
Hypothesis is a predictive statement, capable of being tested by scientific methods, that relates an independent variables to some dependent variable.
A hypothesis states what we are looking for and it is a proportion which can be put to a test to determine its validity
e.g. Students who receive counseling will show a greater increase in creativity than students not receiving counseling
Characteristics of Hypothesis
- Clear and precise.
- Capable of being tested.
- Stated relationship between variables.
- limited in scope and must be specific.
- Stated as far as possible in most simple terms so that the same is easily understand by all concerned. But one must remember that simplicity of hypothesis has nothing to do with its significance.
- Consistent with most known facts.
- Responsive to testing with in a reasonable time. One can’t spend a life time collecting data to test it.
- Explain what it claims to explain; it should have empirical reference.
The Purpose of a Hypothesis
A hypothesis is used in an experiment to define the relationship between two variables. The purpose of a hypothesis is to find the answer to a question. A formalized hypothesis will force us to think about what results we should look for in an experiment.
The first variable is called the independent variable. This is the part of the experiment that can be changed and tested. The independent variable happens first and can be considered the cause of any changes in the outcome. The outcome is called the dependent variable. The independent variable in our previous example is not studying for a test. The dependent variable that you are using to measure outcome is your test score.
Let’s use the previous example again to illustrate these ideas. The hypothesis is testable because you will receive a score on your test performance. It is measurable because you can compare test scores received from when you did study and test scores received from when you did not study.
A hypothesis should always:
- Explain what you expect to happen
- Be clear and understandable
- Be testable
- Be measurable
- And contain an independent and dependent variable
How to Develop a Hypothesis
Another important aspect of a hypothesis is that it should be based on research. Remember that the purpose of a hypothesis is to find the answer to a question. The first thing you should do if you want to answer a question is to find as much information on the topic as you can. Before you come up with a specific hypothesis, spend some time doing research. Then, start thinking of questions you still have. After thoroughly researching your question, you should have an educated guess about how things work. This guess about the answer to your question is where your hypothesis comes from.
Let’s imagine that you want to know why the leaves on the tree in your front yard change color in the fall. First, you would research this phenomenon. You observe what you see happen and read about the subject. You discover that the color change happens when the temperature cools. What question does this information make you ask?
You come up with the following question: ‘Does temperature cause the leaves to change color on the tree in my front yard?’ Next, you ask yourself if this can be tested. If it can be tested, you’ll write a hypothesis that states what you expect to find. Your hypothesis could be ‘If lower temperatures cause leaves to change color and the temperature surrounding a tree is decreased, then the leaves will change color.’
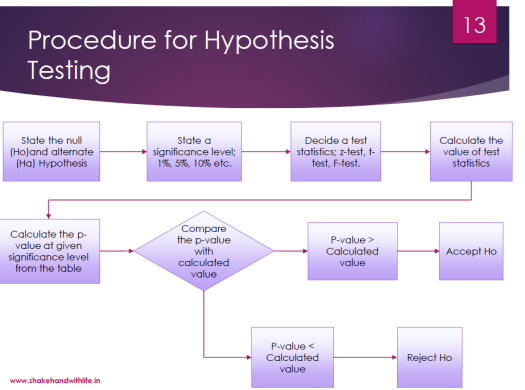
Hypothesis Testing
Hypothesis testing is the formal procedure used by statisticians to test whether a certain hypothesis is true or not. It’s a four-step process that involves writing the hypothesis, creating an analysis plan, analyzing the data, and then interpreting the data. These tests are useful because you can use these tests to help you prove your hypotheses. If you have a successful test, then you can publish that information to let people know what you have found.
For example, a cleaning company can publish information that proves that their cleaning product kills 99% of all germs if they perform a hypothesis test that has data that proves their hypothesis that their cleaning product kills 99% of germs.
While these tests can be very helpful, there is a danger when it comes to interpreting the results. It is possible to make two different kinds of errors when interpreting the results.
Type I Errors
The first type is called a type I error. This type of error happens when you say that the null hypothesis is false when it is actually true. Our null hypothesis is the hypothesis for our expected outcome. If our null hypothesis is that dogs live longer than cats, it would be like saying dogs don’t live longer than cats, when in fact, they do. To help you remember this type I error, think of it as having just one wrong. You are wrongly thinking that the null hypothesis is true. In statistics, we label the probability of making this kind of error with this symbol:
| ∝ |
It is called alpha. This is a value that you decide on. Usually, it is 0.05, which means that you are okay with a 5% chance of making a type I error. The lower the alpha number, the lower the risk of you making such an error. The tricky part with setting the alpha number is that if you set it too low, it may mean that you won’t catch the really small differences that may be there.
Type II Errors
The other type of error is called a type II error. This type of error happens when you say that the null hypothesis is true when it is actually false. For our null hypothesis that dogs live longer than cats, it would be like saying that dogs do live longer than cats, when in fact, they don’t. To help you remember a type II error, think of two wrongs. You are wrongly thinking that the null hypothesis is wrong. The probability of making a type II error is labeled with a beta symbol like this:
| β |
This type of error can be decreased by making sure that your sample size, the number of test subjects you have, is large enough so that real differences can be spotted. So, for the dogs and cats, this would mean that you need to gather data about enough dogs and cats to see a real difference between them. If you have information about just one dog and one cat, you can’t say for sure that the statement that dogs live longer than cats is true or not. If the dog lives longer than the cat, then you might make the mistake of saying that dogs do live longer than cats, even though the opposite were true. Your sample size isn’t large enough for you to see a difference.
If you take this beta value and you subtract it from 1 (1 – beta), you will get what is called the power of your test. The higher the power of your test, the less likely you are to make a type II error.
| Type I and Type II Error Situation | Decision | ||
| Accept Null | Reject Null | ||
| Null is true | Correct | Type I error
(𝛼𝑒𝑟𝑟𝑜𝑟) |
|
| Null is false | Type II error
(𝛽𝑒𝑟𝑟𝑜𝑟) |
Correct | |
Null Hypothesis
It is an assertion that we hold as true unless we have sufficient statistical evidence to conclude otherwise.
- Null Hypothesis is denoted by 𝐻0
If a population mean is equal to hypothesised mean then Null Hypothesis can be written as
𝐻0:𝜇=𝜇0
Alternative Hypothesis
- The Alternativehypothesis is negation of null hypothesis and is denoted by 𝐻𝑎
If Null is given as 𝐻0:𝜇=𝜇0
Then alternative Hypothesis can be written as
𝐻𝑎:𝜇≠𝜇0
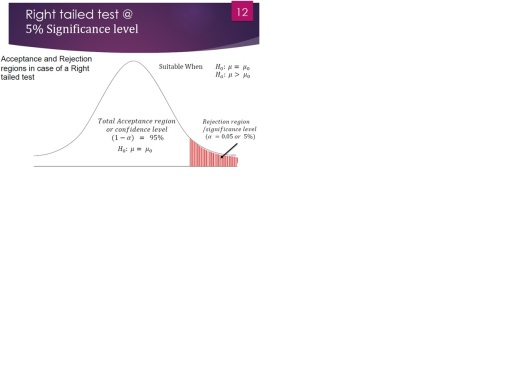
𝐻𝑎:𝜇>𝜇0
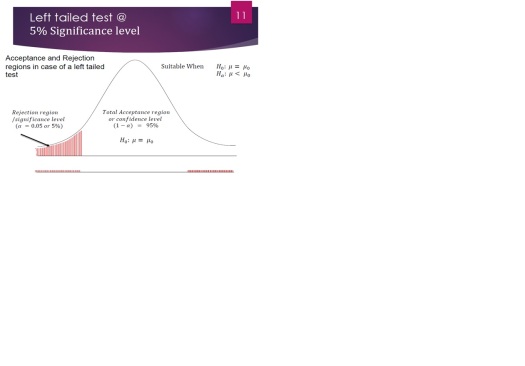
𝐻𝑎:𝜇<𝜇0
Level of significance and confidence
Significance means the percentage risk to reject a null hypothesis when it is true and it is denoted by 𝛼. Generally taken as 1%, 5%, 10%
- (1−𝛼)is the confidence interval in which the null hypothesis will exist when it is true.